Trait Associations in Some Durum Wheat (Triticum durum L.) Accessions among Yield and Yield related Traits at Kulumsa, South Eastern Ethiopia
Received: 09-Jul-2016 / Accepted Date: 30-Jul-2016 / Published Date: 01-Aug-2016 DOI: 10.4172/2329-8863.1000234
Abstract
Wheat (Triticum durum L.) is the leading source of cereal and vegetable protein in human food, having higher protein content than either maize (corn) or rice, the other major cereals. The objective was to study the association among grain yield and related traits and identify traits those have the most direct and indirect effects on grain yield. Sixty eight durum wheat accessions tested in an augmented block design. Twelve yield and related traits were recorded in the investigation. Analysis of variance revealed highly significant differences among accessions for all traits. Grain yield showed positive and significant correlation with grain filling period, productive tillers per plant, number of grains per spike, spikelets per spike, 1000 grain weight, biological yield and harvest index at both phenotypic and genotypic levels. This implies that through improving these traits possible to improve grain yield. Path coefficient analysis showed that harvest index and biological yield revealed high positive direct effect and positively high significant correlations with grain yield. Indicated these two characters can be considered for direct selection. However the present outcome is only an indication and we cannot reach a definite conclusion. Therefore, it is sensible to conduct a follow up study by incorporating more characters over different years and locations.
Keywords: Durum wheat accessions; Yield related traits; Ethiopia
Introduction
Durum wheat (Triticum durum L.) is a monocotyledonous plant of the Gramineae family of the Triticeae tribe that belongs to the genus Triticum. For commercial production and human consumption, it is the second most important Triticum species, next to common wheat (Triticum aestivum L.) (Garcia et al. and Simane et al.) [1,2]. It is the only tetraploid (AABB, 2n=4x=28) species of wheat which has commercially a great importance and carries raw material of numerous foods such as macaroni and semolina in alimentation of world population and it is a promising and viable alternative crop for farmers Shewry [3].
The nutritional composition indicated that 100 g of Durum wheat provides 339 calories and it consisted carbohydrate 71 g, protein 14 g, fat 2.5 g, minerals 2 g and considerable proportions of vitamins (thiamine and vitamin-B) and minerals (zinc, iron). It is also a good source of traces minerals like selenium and magnesium, nutrients which are essential to good health Belay [4]. In Ethiopia durum wheat is used to prepare local food recipes: kitta (unleavened bread), Injera (spongy flat unleavened bread), Kinche (boiled coarse-ground wheat), Nifro (boiled whole grain), Kollo (roasted grain), dabo-kollo (ground and seasoned dough) etc. [5].
Grain yield of wheat is multifaceted quantitative trait that outcome to the actions and interactions of various component traits [6]. Thus, analysis of Correlation coefficient could be used as an vital tool to give the interrelationship of yield and yield contributing traits. It is also used to measure the strength and the direction of the relationships among the different characters and grain yield [7]. Correlation and path coefficient analysis could be used as important tools to bring information about appropriate cause and effect relationship between yield and some yield components [8]. Understanding the interrelationship between component characters will help in determining which character to be selected and when it is improved in relation to the desired characters.
The knowledge of the genetic relationship between grain yield and its components can help the breeders to improve the success and efficiency of the selection. In durum wheat to select genotypes of good yielder and the traits which contribute for the yield efficiency, it is important to study the relationships among the traits and find out their direct and indirect effects on grain yield [9]. A number of research finding showed that, the correlation coefficient measures the mutual relationship between various plant characters and determines the component characters on which selection can be based for the improvement in associated complex characters and yield [10-12]. Assessment of correlation coefficients between various yield traits helps to develop wheat cultivars with best combinations of yield attributes in wheat for obtaining higher yield [13]. In effective plant breeding program, identifying characters contributing to grain yield is important as it amplify breeding effectiveness. Therefore, the objective of this study was to assess the association among yield and yield contributing traits and identify traits those have the most direct and indirect effects on grain yield.
Materials and Methods
Description of the study area
The field experiment was conducted at Kulumsa Agricultural Research Center (8° to 8° 2ˈ northern latitude and 39° 07ˈ to 39° 10ˈeastern longitude) which is located 160 km southeast of Addis Ababa and it is located at 8 km north of Asela town. The altitude of the center is 2200 masl with annual average rainfall of 832 mm. The annual average temperature of the study area is 16.65°C with maximum and minimum temperature of 22.8°C and 10.5°C respectively. With the soil type classified as clay loam soil with a pH of 6 (Source: Secondary data from KARC).
Experimental material
The entries for this study consisted of 68 durum wheat (T. durum L.) (64 land races and 4 released variety).
Experimental design and trial management
The field experiment was laid down in an Augmented Block Design having 4 blocks where each block contains 16 test entries and 4 checks (randomly allocated) with the total of 20 accessions in each blocks and accession was sown in 2 rows of 1.25 meter long and 20 cm apart. The recommended fertilizer rate of 100/100 kg/ha N/P2O5 in the forms of Urea and DAP was applied to each plot in the shallow furrow depths and mixed with soil at the same time during sowing. Other agronomic practices such as weeding were followed uniformly to all plots according to the recommendation of the location. No herbicide was applied to control weeds.
Data collected on-plant basis
The data on plant basis were taken for each accession from ten randomly taken plants as follows:
➢ Plant height (cm): The plant height for randomly taken samples was measured in centimeter from ground level of the plant to the base of the spike excluding awns.
➢ Spike length (cm): Spike length was recorded from the bath of the spike to the tip and it was recorded from randomly taken plants and measured in centimeters.
➢ Number of spikelets per spike: Total number of spikelets on main spike of all ten plants was counted at the time of maturity and the average was recorded.
➢ Number of productive tillers per plant: The number of tillers per plant bearing productive heads was counted and average was recorded for the ten randomly taken plants
➢ Number of grains per spike: The spike of the selected plants was threshed manually and numbers of grains per spike was counted for each accession at the time of harvest.
On plot basis
➢ Days to heading: The number of days taken from the date of sowing to the day on which the main ear comes out of the flag leaf completely in 50 per cent of the plants.
➢ Days to maturity: The numbers of days from date of sowing to a stage at which 75% of the plants have reached physiological maturity or 75% of the spikes on the plots turned golden yellow color were calculated.
➢ Grain Filling Period (GFP): The grain filling period in days was computed by subtracting the number of days to heading from the number of days to maturity.
➢ 1000 grain weight (TGW) (g): The weight (g) of 1000 grain from randomly sampled seeds per plot measured by using sensitive balance.
➢ Grain Yield (GY) (kg/ha): The grain yield per plot was measured in grams using sensitive balance after moisture of the seed is adjusted to 12.5%. Total dry weight of grains harvested from the two rows was taken as grain yield per plot and expressed in kg/ha.
➢ Biomass Yield (BMY) (kg/ha): It was recorded by weighing the total above ground biological yield harvested from all the plots of each accession at the time of harvest and converted to kg/ha.
➢ Harvest Index (HI) (%): It was estimated by dividing grain yield per plot to biological yield per plot. It is the ratio of grain yield to the above ground biomass yield.
Statistical analysis
The analysis of variance for each character was performed using the SPAD software developed by IASRI, New Delhi, India. Phenotypic and genotypic correlation and path coefficient analysis GENRES Statistical Soft ware or Package [14].
Correlation coefficient (r): Phenotypic and genotypic correlations between yield and yield related traits were estimated using the method described by Miller et al. [15] and tested for statistical significance against the correlation table values at 5 and 1% levels of significance. The statistical procedures were as follows:
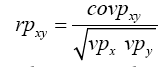
Where: rpxy is phenotypic correlation coefficient between character x and y
covpxy, phenotypic covariance between character x and y
vpx, phenotypic variance for character x
vpy phenotypic variance for character y
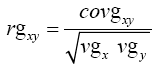
Where: rgxy, genotypic correlation coefficient between character x and y
covgxy, genotypic covariance between character x and y
vgx, genotypic variance for character x
vgy, genotypic variance for character y
The correlation coefficients were worked out to determine the degree of association of a character with yield and among the yield components. where ‘n’ is the number of genotypes. To test the significance of correlation coefficients, the following formula was adopted [16]:
T=r/SE(r)
Where, 
Where, r is correlation coefficient; n is number of genotypes. To test the significance of correlation coefficient, the calculated t-value can be compared with tabulated t-value at (n-2) degree of freedom at 0.05 and 0.01 levels of probability [17].
Path coefficient analysis: The path coefficient analysis was carried out using GENRES Statistical Software Package [14] to study the direct and indirect contributions of the traits to the associations. A measure of direct and indirect effects of each character on grain yield was estimated using a standardized partial regression coefficient known as path coefficient analysis, as suggested by Dewey and Lu [18]. Thus, correlation coefficient of different characters with grain yield was partitioned into direct and indirect effects adopting the following formula.

Where: rij=mutual association between the independent variable ‘i’ and the dependent variable ‘j’ as measured by correlation coefficient.
pij=components of direct effects of the independent variable ‘i’ on dependent variable ‘j’ as measured by the path coefficient.
Σrik pkj = Summation of component of indirect effects of independent trait ‘i’ on the given dependent trait ‘j’ via all other independent variable ‘k’.
The contribution of the remaining unknown factor was measured as the residual factor. It was calculated by:
Residual effect 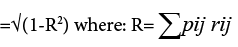
Results and Discussion
Analysis of variance (ANOVA)
The analysis of variance for the 12 characteristics is presented in Table 1. It revealed that significant (P<0.1) differences were observed among the genotypes for all characters studied y. This gives an ample opportunity to plant breeders for improvement of these characters through selection. Similarly, the research finding of Abinasa [19] reported highly significant differences among durum wheat genotypes for days to heading, days to maturity, number of productive tillers per plant, plant height, spike length, spikilets per spike, thousand grain.
|
Character |
Block(adj) (df=3) |
Error (df=9) |
TG(adj) (df=67) |
SC (df=3) |
AC (df=63) |
AC vs. SC (df=1) |
CV (%) |
|---|---|---|---|---|---|---|---|
|
Days to heading(days) |
1.22 | 4.95 | 38.23** | 118.22** | 32.48** | 161.02** | 3.37 |
|
Days to maturity(days) |
5.16 | 2.83 | 52.64** | 36.66** | 47.88** | 400.51** | 1.51 |
|
Grain filling period(days) |
4.22 | 12.11 | 57.15** | 273.22** | 30.79* | 1069.45** | 7.67 |
|
Plant height (cm) |
1.66 | 1.13 | 304.07** | 57.01** | 61.35** | 16336.32** | 0.92 |
|
No. of productive tillers plant- |
0.68 | 0.62 | 2.12* | 0.50ns | 1.64* | 37.46** | 16.55 |
|
Spike length (cm) |
0.68 | 0.50 | 3.01** | 0.85ns | 1.33* | 115.80** | 8.25 |
|
Number of spikelets spike-1 |
2.64 | 1.15 | 5.1* | 3.18ns | 4.14* | 71.25** | 5.23 |
|
Number of kernels spike-1 |
4.72 | 4.11 | 118.43** | 283.22** | 46.75** | 4140** | 5.53 |
|
Thousand kernels weight (g) |
8.05 | 3.30 | 142.99** | 300.60** | 38.28** | 6267.21** | 7.43 |
|
Grain yield plot-1 (g) |
4.91 | 9.75 | 295.13** | 128.41** | 146.51** | 10158.77** | 10.12 |
|
Biomass yield plot-1 (g) |
6.22 | 11.17 | 1336.67** | 1050.89** | 1264.31** | 6752.81** | 2.07 |
|
Harvest index (%) |
3.08 | 3.744 | 89.02** | 2.74ns | 58.16** | 2292.15** | 10.16 |
Df=Degrees of freedom; *, ** Significant at 5% and 1% probability level respectively; CV=Coefficient of Variation; TG=Total genotypes; SC=Standard checks; AC=Accessions.
Table 1: Analysis of variance (Mean squares) for the 12 characters of 68 durum wheat accessions.
Correlation of grain yield with other traits: The phenotypic and genotypic correlation coefficients among the characters were presented in Table 2. The results showed that generally the genotypic correlation coefficients (rg) were higher than the phenotypic correlation coefficients (rp) indicating the association among these characters were under genetic control and indicating the preponderance of genetic variance in expression of characters. Grain yield was positively and significantly correlated with grain filling period (0.37**, 0.32**), number of grain yield per spike (0.42**, 0.41**), thousand grain weight (0.43**, 0.42**), biomass yield (0.34**, 0.33**), harvest index (0.59**, 0.57**) and productive tillers per plant (0.27*, 0.23*) at both genotypic and phenotypic levels respectively. It implies that improving one or more of the above characters could result in high grain yield. Similarly, Tsegaye et al. [20] reported that grain yield had positive and significant phenotypic and genotypic correlations with number of tillers per plant, thousand grain weigh, biological yield and harvest index.
| HD | MD | GF | PH | FTPP | SL | SPS | KPS | TGW | BMY | HI | GY | |
|---|---|---|---|---|---|---|---|---|---|---|---|---|
| HD | 1.0 | 0.51** | -0.36** | 0.14 | 0.11 | 0.25* | 0.62** | 0.014 | -0.07 | 0.012 | -0.26* | -0.19 |
| MD | 0.46** | 1.0 | 0.55** | 0.03 | 0.17 | 0.11 | 0.51** | 0.24* | 0.14 | 0.27* | 0.11 | 0.19 |
| GF | -0.29* | 0.47** | 1.0 | -0.08 | 0.08 | -0.09 | 0.002 | 0.24* | 0.21 | 0.27* | 0.32** | 0.37** |
| PH | 0.13 | 0.03 | -0.07 | 1.0 | -0.11 | 0.23* | 0.12 | -0.17 | -0.2 | -0.02 | -0.15 | -0.16 |
| PTPP | 0.09 | 0.14 | 0.06 | -0.09 | 1.0 | -0.007 | 0.16 | 0.29* | 0.31** | -0.15 | 0.38** | 0.27* |
| SL | 0.21 | 0.1 | -0.08 | 0.19 | -0.005 | 1.0 | 0.55** | -0.18 | 0.24* | -0.005 | -0.16 | -0.17 |
| SPS | 0.51** | 0.44** | 0.002 | 0.1 | 0.12 | 0.44** | 1.0 | 0.23* | -0.18 | 0.19 | 0.24* | 0.24* |
| NGPS | 0.013 | 0.23* | 0.21 | -0.17 | 0.23* | -0.16 | 0.21 | 1.0 | 0.36** | 0.2 | 0.4** | 0.42** |
| TGW | -0.07 | 0.14 | 0.19 | -0.2 | 0.25* | -0.22 | -0.17 | 0.35** | 1.0 | 0.18 | 0.43** | 0.43** |
| BMY | 0.01 | 0.26* | 0.24* | -0.02 | -0.12 | -0.005 | 0.17 | 0.19 | 0.18 | 1.0 | -0.04 | 0.34** |
| HI | -0.24* | 0.11 | 0.28* | -0.14 | 0.31** | -0.14 | 0.2 | 0.38** | 0.41** | 0.03 | 1.0 | 0.59** |
| GY | -0.18 | 0.18 | 0.32** | -0.16 | 0.23* | -0.15 | 0.23* | 0.41** | 0.42** | 0.33** | 0.57** | 1.0 |
T=0.23 (p<0.05) and T=0.302 (p<0.01) for df=n-2 where, n=number of genotypes, DH=days to heading, MD=days to maturity, GF=grain filling period, PH=plant height, PTPP=productive tillers per plant, SL=spike length, SPS=spikeletes per spike, NGPS=number of grains per spike, TGW=thousand grain weight, BMY=biomass yield, HI=harvest index and GY=grain yields.
Table 2: Estimates of phenotypic (below diagonal bold) and genotypic (above diagonal not bold) correlation coefficients among yield and yield components in 68 durum wheat accessions tested at Kulumsa (2013/2014).
Yousaf et al. [21] reported that yield per plant had highly significant and positive genotypic and phenotypic correlations with number of productive tillers per plant, number of spikelets and number of grains per spike had significant positive correlations with spike length at both levels. Tila et al. [22] found that the biological yield and harvest index had positive and significant genotypic and phenotypic correlations with grain yield. Ahmad et al. and Akcura (Ali and Shakor and Peymaninia et al.) [10,23-25] also reported strong positive correlation of biomass yield and harvest index on grain yield in wheat.
Correlation among characters
Phenotypic and genotypic correlation: Days to heading showed positive and significant correlation with days to maturity (0.46**, 0.51**) at both phenotypic and genotypic levels (Figures 1 and 2; Table 3). Similarly, Khan et al. [8] reported days to maturity are positively and significantly correlated with days to heading at both phenotypic and genotypic levels. However, it displayed negative and significant association with grain filling period at both phenotypic and genotypic levels (-0.29*, -0.32**) indicating that the shorter days to heading have the longer grain filling period but, it had positive and highly significant association with days to maturity at both phenotypic and genotypic levels these showed the difficulty in simultaneous improvement of these traits. It had also revealed positive and highly significant correlation with spikelets per spike (0.51**, 0.62**) at both phenotypic and genotypic levels while, significant and positive correlation with spike length at genotypic level (0.24*). It implies that the longer flowering period will enhance the possession of sufficient spikelets per spike accompanied by long spike length. On the contrary, it was found negative and significant correlation with harvest index (-0.24*, -0.26*) at both phenotypic and genotypic levels.

Figure 1: Graphic presentation of genotypic correlations of different traits with grain yield.
DH=Days to heading, MD=Days to maturity, GF=Grain filling period, PH=Plant height, PTPP=Productive tillers per plant, SL=Spike length, SPS=Spikeletes per spike, NGPS=Number of grains per spike, TGW=Thousand grain weight, BMY=Biomass yield, HI=Harvest index and GY=Grain yields

Figure 2: Graphic presentation of phenotypic correlations of different traits with grain yield.
DH=Days to heading, MD=Days to maturity, GF=Grain filling period, PH=Plant height, PTPP=Productive tillers per plant, SL=Spike length, SPS=Spikeletes per spike, NGPS=Number of grains per spike, TGW=Thousand grain weight, BMY=Biomass yield, HI=Harvest index and GY=Grain yields
| Characters | HD | MD | GF | PH | FTPP | SL | SPS | KPS | TGW | BIOY | HI | GYg |
|---|---|---|---|---|---|---|---|---|---|---|---|---|
| HD | 0.072 | -0.054 | -0.035 | -0.009 | 0.002 | -0.010 | 0.019 | 0.001 | -0.0004 | 0.005 | -0.217 | -0.19 |
| MD | 0.037 | -0.105 | 0.056 | -0.002 | 0.004 | -0.005 | 0.008 | 0.017 | 0.0008 | 0.128 | 0.108 | 0.19 |
| GF | -0.027 | -0.063 | 0.093 | 0.006 | 0.002 | 0.004 | 0.022 | 0.018 | 0.001 | 0.134 | 0.320 | 0.37** |
| PH | 0.015 | -0.006 | -0.012 | -0.044 | -0.004 | -0.014 | 0.003 | -0.019 | -0.002 | -0.015 | -0.208 | -0.16 |
| NPTPP | 0.007 | -0.016 | 0.007 | 0.007 | 0.024 | 0.0002 | 0.012 | 0.018 | 0.002 | -0.059 | 0.314 | 0.27* |
| SL | 0.020 | -0.014 | -0.011 | -0.017 | -0.0002 | -0.035 | 0.029 | -0.015 | -0.002 | -0.003 | -0.173 | -0.17 |
| SPS | 0.041 | -0.051 | 0.025 | -0.007 | 0.003 | -0.021 | 0.026 | 0.0003 | -0.0004 | 0.034 | -0.108 | 0.24* |
| NGPS | 0.001 | -0.034 | 0.031 | 0.015 | 0.008 | 0.009 | 0.023 | 0.054 | 0.003 | 0.117 | 0.490 | 0.42** |
| TGW | -0.007 | -0.022 | 0.030 | 0.020 | 0.009 | 0.014 | -0.012 | 0.037 | 0.004 | 0.119 | 0.575 | 0.43** |
| BMY | 0.0008 | -0.029 | 0.027 | 0.002 | -0.003 | 0.0002 | 0.0021 | 0.014 | 0.001 | 0.452 | -0.033 | 0.34** |
| HI | -0.019 | -0.014 | 0.037 | 0.011 | 0.009 | 0.007 | -0.0032 | 0.033 | 0.003 | -0.018 | 0.810 | 0.59** |
Residual=0.195; DH=Days to heading, DM=Days to maturity, GFP=Grain filling period, PH=Plant height (cm), NPTPP=No. of productive tillers plant-1, SL=Spike length (cm), NSPS=No. of spikelets spike-1, NGPS=No. of grains spike-1, TKW=1000 kernel weight (g), GY=Grain yield ha-1, BMY=Biomass yield tons ha-1 and HI=Harvest index.
Table 3: Estimate of direct effect (bold face and diagonal) and indirect effects (off diagonal) at genotypic level in 68 durum wheat accessions tested at Kulumsa (2013/14).
The association of maturity date with grain filling period displayed positive and highly significant at both phenotypic and genotypic levels (0.47**, 0.55**), indicating that the given durum wheat accessions required sufficient maturity time to posses more grain. It had also showed positive and significant association with spikelets per spike (0.44**, 0.51**), number of kernels per spike (0.23*, 0.24*) and biomass yield (0.26*, 0.27*) at both phenotypic and genotypic levels, indicating to improve these traits it needs long maturation time. This implies that to improve yield contributing traits in the study require enough maturation periods. The result is in agreement with Gashaw et al. [7].
Grain filling period had positive and significant correlation with biomass yield (0.24*, 0.27*) and harvest index (0.28*, 0.32**) at both phenotypic and genotypic level while, positive and significant with number of kernels per spike (0.24*) only at genotypic level. Plant height revealed positive and significant correlation with spike length (0.24*) at genotypic level where as insignificant and positive at phenotypic level. Iqbal et al. [26] found similar results in their studies. It indicated the tall wheats may possess long spike and accompanied to hold adequate amount of spikelets. Thus, the result exhibited the accessions of durum wheat have tall nature and susceptible to lodging. It is in agreement with Abinasa et al. [19] reported that negative and non significant correlation was observed for plant height with kernels number perspike and grain yield and similar finding also presented by Majumder et al. [27]. However, it contradicted the reports of Gashaw et al. [7] displayed that plant height had positive and significant correlation with number of kernels per spike, biomass yield, and thousand kernel weight at both phenotypic and genotypic levels.
The association of productive tillers per plant exhibited positively and highly significant to significant with number of grains per spike (0.23*, 0.29*), thousand grain weight (0.25*, 0.31**) and harvest index (0.31**, 0.38**), indicating that selection based on productive tillers per plant may lead to promotion of these traits. It contradicted the finding of Iftikhar et al. [28]. Spike length exhibited positively and highly significant with spikelets per spike (0.44**, 0.55**) at both phenotypic and genotypic levels. This showed the longer spike length may possess more numbers of spikelets and able to produce sufficient yield, so that selection based on this traits would improve the grain yield in durum wheat. The result is in agreement with Iftikhar et al. and Bilgin et al. [28,29]. It had also showed positive and significant correlation with thousand grain weight at genotypic level (0.24*).
Spikelets per spike revealed positive and significant correlation with number of kernels per spike (0.23*) and harvest index (0.24*) at genotypic level. The result is partially in agreement with Ali et al. [30]. The association of number of grains per spike showed positively and highly significant with thousand grain weight (0.35**, 0.36**) and harvest index (0.38**, 0.40**) at both phenotypic and genotypic levels, suggested that high grain numbers per spike required for the improvement of both thousand grain weight and harvest index. The result is in accordance with Akcura and Iftikhar [23,28] but, it was contradicted the finding of Yousaf and Dutamo [21,31]. On the other hand it revealed positive and insignificant association with biomass yield at both levels. Thousand grain weight showed positively and highly significant correlation with harvest index (0.41**, 0.43**) at both genotypic and phenotypic levels whereas positive and insignificant with biomass yield at both levels. It is partially in accordance with the finding Abinasa et al. [19]. The association of biomass yield exhibited insignificant and positive with harvest index at phenotypic level while, negative and insignificant at genotypic level.
Path coefficient analysis
Direct and indirect effects: The genotypic direct and indirect effects of different characters on grain yield are presented in Table 3. The results of path coefficient analysis of the study revealed that almost all characters exhibited positive direct effect except days to maturity, plant height and spike length. The maximum positive direct effect was exhibited on grain yield by harvest index (0.81**). It had also positive and highly significant genotypic correlation with grain yield makes the direct selection of this character is effective for yield improvement. The result confirms the finding of Abinasa et al. and Izzat et al. [19,32]. The indirect effects of this character were positive with grain filling period and number of kernels per spike. But, it had negative and negligible indirect effects for the rests of the traits. Therefore, harvest index, grain filling periods and number of kernels per spike should be considered in durum wheat breeding program designed to simultaneously improve grain yield.
Biomass yield had positive direct effects as well as significant positive correlation with grain yield (0.45). The indirect effects via maturity date, productive tillers per plant, and harvest index are negative whereas, indirect effects via days to heading, grain filling period, plant height, spike length, spikelets per spike, number of kernels per spike and thousand grain weight were positive. The result suggested that the direct selection of biomass yield will improve grain yield effectively. On the other hand the indirect selection of grain filling period, plant height, spike length, spikelets per spike, number of kernels per spike and thousand grain weight via biomass yield will improve grain yield. It confirms the finding of Ali [24] and Similarly, Hannachi et al. [33] who reported that biomass and harvest index exerted positive direct effect on grain yield.
Days to maturity exhibited negative direct effects on grain yield, even though it had positive correlation, indicating that indirect effects to be cause of correlation. Thus, the negative direct effect of days to maturity was counter balanced by its positive indirect effects via days to heading, grain filling period, biological yield and harvest index as well as rendered the positive genotypic correlation coefficient. Grain filling period showed positive direct effect and positive genotypic correlation on grain yield, it indicated that this trait should be considered in further selection procedures for higher grain yield. The indirect effects of this trait were positive and high to moderate with harvest index and biomass yield respectively but, it had negative indirect effects with days to heading and maturity date however, negligible positive indirect effects for the rest traits. Days to heading had positive direct effects with grain yield. Oğuz et al. [34] reported similar results in durum wheat. However, the correlation coefficient it had with grain yield was negative this negative relationship between early flowering accompanied with sufficient grain filling period characters and grain yield is desirable if stresses conditions such as terminal heat and drought are expected during growing season. This suggestion can be justified by earlier report of Gelalcha and Hanchinal [35] in which correlation between days to flowering and days to maturity with grain yield was negative but, this result is weak agreement with maturity date. The indirect effect of days to heading was negative and high with harvest index, days to maturity and grain filling periods whereas positive and weak effects with the rest of the traits.
Number of grains per spike revealed positive direct effects and positively high significant correlation with grain yield, it reflect that this characteristic is essential to improve grain yield directly. The indirect effects were showed positive for all characteristics except for days to maturity. It exhibited high positive indirect effects with harvest index, biological yield and grain filling period. Thus, the indirect selection of all these traits via number of grains per spike may evolve high yielding genotypes. This result is in agreement with Dogan [36] who reported direct positive effect of grain number per spike and 1000-grain weight on yield.
Productive tillers per plant manifested positive direct effect and significant positive correlation with grain yield. Hence, selection for yield improvement can be done on the basis of productive tillers per plant. The indirect effects of this trait were positive with days to heading, grain filling period, plant height, spike length, spikelets per spike, number of kernels per spike, thousand grain weight and harvest index. It indicated that the improvement of one of these traits via productive tillers per plant will improve grain yield in durum wheat. However, it showed negative indirect effect via biomass yield and maturity date. Spike length showed negative direct effects and negative correlation with grain yield this indicated that the direct selection of this trait is not crucial unless together with indirect effects. The indirect effect of this characteristic was highly significant positive correlation with spikelets per spike indicated not only the length of spike but also incorporated with spikelet number to improve grain yield under selection. On the other hand it exhibited negligible and negative indirect effects for the of rest traits rather than days to heading.
Thousand grain weight revealed weak positive direct effects and highly significant positive genotypic correlation with grain yield. The result indicated that even though it had weak positive direct effects, the correlation was strong because the positive and high indirect effects with harvest index, biomass yield, number of kernels per spike and grain filling period renders its correlation to be stronger. Residual effect in the present study was 0.195 (Table 3) which indicated the traits in the path analysis expressed the variability in grain yield by 80.5%.
Conclusion
The genotypic and phenotypic correlation of grain yield was positive and significant with grain filling period, number of productive tillers per plant, number of spikelet’s per spike, number of grains per spike, thousand grain weight, biomass yield and harvest index. Indicated that these characters contributed positively towards yield, and should be considered when selecting for high grain yield. Path coefficient analysis showed that biological yield and harvest index showed positive direct effect and highly significant positive correlation. Therefore, much attention should be given to them as there traits are helpful for direct selection.
Acknowledgements
The authors would like to thank Jimma University College of Agriculture and Veterinary Medicine (JUCAVM) and Kulumsa Agricultural Research Center (KARC) for their financial support.
References
- Garcia MLF, Ramos JM, Garcia MMB, Jimenez TP (1991) Ontogenetic approach to grain production in spring barley basedon path coefficient analysis. Crop Science 31:1179-1185.
- Simane B, Struik PC,Nachit MM, Peacock JM (1993) Ontogenic analysis of field components and yield stability of durum wheat in water limited environments. Euphytica 71:211-219.
- Shewry P (2009) Increasing the health benefits of wheat. FEBS Journal 276:71-71.
- Belay G (2006) Triticum turgidum L. In: Cereals and pulses/Céréales et légumes secs, PROTA, Wageningen, Netherlands.
- Badebo A, Gelalcha S, Ammar K, Nachit MM, Abdalla O (2009) Overview of durum wheat research in Ethiopia: Challenges and prospects Paper presented at the Proceedings of Borlaug Global Rust Initiative technical workshop, Cd. Obregon, Sonora, Mexico.
- Singh SP, Dewivedi VK (2002) Character association and path analysis in wheat. Agric Sci Digest 22:255-257.
- Gashaw A, Mohammed H, Singh H (2007) Selection criterion for improved grain yields in Ethiopian durum wheat genotypes. Afr Crop Sci J 15: 25-31.
- Khan AS, Ashfaq M, Asad MA (2003) A correlation and path coefficient analysis for some yield components in bread wheat. Asian J of Plant Sci 2: 582-584.
- Flexas J, RibasCarbo MIQ, DiazEspejo ANT, Galmes J, Medrano H (2007) Mesophyll conductance to CO2: current knowledge and future prospects. Plant Cell and Enviro 31: 602-621.
- Ahmad B, Khalil IH, Iqbal M, Hidayat UR (2010) Genotypic and phenotypic correlation among yield components in bread wheat under normal and late plantings. Sarhad J Agric 26:259-265.
- Leilah AA, Al-Khateeb SA (2005) Statistical analysis of wheat yield under drought conditions. Elsevier 61: 483-496.
- Zecevic V, Kenezevic D, Micanovic D (2004) Genetic correlations and path coefficient analysis of yield and quality components in wheat (Triticum aestivum L). Genetika 36:13-21.
- Tahir MHN, Sadaqat HA, Bashir S (2002) Correlation and path coefficient analysis of morphological traits in sunflower (Helianthus annuus L) populations. Int J Agric Biol 4:341-343.
- GENRES statistical software (1994) Data entry module for pascal intl soft ware solution.
- Miller PA, Williams JC, Robinson HF, Comtsock RF (1958) Estimation of genotypic environmental variances and co variances in upland cotton and their implication in selection. Agronomy Journal 50: 126-131.
- Sharma JR (1998) Statistical and biometrical techniques in plant breeding. New Age International Publication, New Delhi, p: 432.
- Snedecor GW, Cochran WG (1989) Statistical Methods. 8th edn. Ames: Iowa State Press.
- Dewey DR, Lu RH (1959) A correlation and path coefficient analysis of components of crested wheat grass seed production. Agron J 51: 515-518.
- Abinasa M, Ayana A, Bultosa G (2011) Genetic variability, heritability and trait associations in durum wheat (Triticum turgidum L var durum) genotypes. African Journal of Agricultural Research 6: 3972- 3979.
- Tsegaye D, Tadesse D, Yigzaw D, Getnet S (2012) Genetic ariability correlation and path analysis in durum wheat germplasm (Triticum durum Desf). African Journal of Biotechnology 1:107-112.
- Yousaf A, Atta BM, Akhter J, Monneveux P, Lateef Z (2008) Genetic variability, association and diversity studies in wheat (Triticum aestivum L.) germplasm. Pak J Bot 40: 2087-2097.
- Tila M, Sajjad H, Muhammad A, Muhammad IK, Roshan Z (2005) Path coefficient and correlation studies of yield and yield associated traits in candidate bread wheat (Triticum aestivum L) lines. Suranaree J Sci Technol 13:175-180
- Akcura M (2011) The relationships of some traits in Turkish winter bread wheat landraces. Turk J Agric For 35:115-125.
- Ali IH, Shakor EF (2012) Heritability, variability, genetic correlation and path analysis for quantitative traits in durum and bread wheat under dry farming conditions. Mesoptamia J Agric 40:27-39.
- Peymaninia Y, Valizadeh M, Shahryari R, Ahmadizadeh M (2012) Evaluation of morpho physiological responses of wheat genotypes against drought stress in presence of a leonardite derived humic fertilizer under greenhouse condition. The Journal of Animal and Plant Sciences 22: 1142-1149.
- Iqbal N, Aqsa T, Hameed A, Arshad R(2007) Evaluation of Pakistani wheat germplasm for bread quality based on allelic variation in HMW glutenin subunits. Pak J Bot 43: 1735-1740.
- Majumder DAN, Shamsuddin AKM, Kabir MA, Hassan L (2008) Genetic variability, correlated response and path analysis of yield and yield contributing traits of spring wheat. J Bangladesh Agric Univ 6:227-234.
- Iftikhar R, Khaliq I, Ijaz M, Rashid MA (2012) Association Analysis of Grain Yield and its Components in Spring Wheat (Triticum aestivum L.). American Eurasian J Agric & Environ Sci 12: 389-39.
- Bilgin O, Korkut KZ, Başer İ, Dağlioğlu O, Öztürk İ, et al. (2008) Determination of variability between grain yield and yield components of durum wheat varieties (Triticum durum desf.) in Thrace region. Journal of Tekirdag Agricultural Faculty 5: 101-109.
- Ali Y, Atta BM, Akhter J, Monneveux P, Lateef Z (2008) Genetic variability, association and diversity studies in wheat (Triticum aestivum L.) germplasm. Pak J Bot 40: 2087- 2097.
- Dutamo D, Alamerew S, Eticha F, Assefa E (2015) Path Coefficient and Correlation Studies of Yield and Yield Associated Traits in Bread Wheat (Triticum aestivum L.) Germplasm. World Applied Sciences Journal 33: 1732-1739.
- IzzatSA, Tahir ISA, AbdallaBE, Abu EH, Ibrahim S, et al. (2000) Genetic improvement in grain yield and associated changes in traits of bread wheat cultivars in the Sudan. In: CIMMYT 2000 The Eleventh Regional Wheat Workshop for Easter Central and Southern Africa. Addis Ababa Ethiopia: CIMMYT, p: 60-66.
- Hannachi A, Fellahi ZEA, Bouzerzour H, Boutekrabt A (2013) Correlation, Path Analysis and Stepwise Regression in Durum Wheat (Triticum Durum Desf.) under Rainfed Conditions. Journal of Agriculture and Sustainability 3:122-131.
- Oğuz B, Kayihan ZK, İsmet B, Orhan D, İrfan Ö (2011) Genetic variation and inter-relationship of some morpho-physiological traits in durum wheat (Triticum durum L.) desf. Pak J Bot 43: 253-260.
- Gelalcha S, Hanchinal RR (2013) Correlation and path analysis in yield and yield components in spring bread wheat (Triticum aestivum L.) genotypes under irrigated condition in Southern India. African Journal of Agricultural Research 8:3186-3192.
- Dogan R (2009) The correlation and path coefficient analysis for yield and some yield components of durum wheat (Triticum turgidum var. durum L.) in west Anatolia conditions. Pak J Bot 41:1081-1089.
Citation: Wolde T, Eticha F, Alamerew S, Assefa E, Dutamo D, et al. (2016) Trait Associations in Some Durum Wheat (Triticum durum L.) Accessions among Yield and Yield related Traits at Kulumsa, South Eastern Ethiopia. Adv Crop Sci Tech 4:234. Doi: 10.4172/2329-8863.1000234
Copyright: © 2016 Wolde T, et al. This is an open-access article distributed under the terms of the Creative Commons Attribution License, which permits unrestricted use, distribution, and reproduction in any medium, provided the original author and source are credited.
Share This Article
Open Access Journals
Article Tools
Article Usage
- Total views: 12103
- [From(publication date): 8-2016 - Apr 18, 2024]
- Breakdown by view type
- HTML page views: 11273
- PDF downloads: 830